Page 31 - Microsoft Word - CEU_MA_Thesis_ARDI_PRIKS_FINAL_v1.3.docx
P. 31
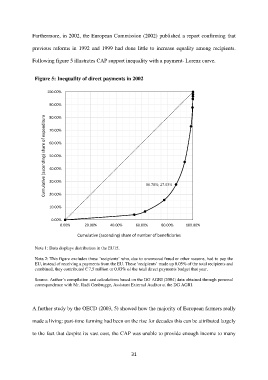
Furthermore, in 2002, the European Commission (2002) published a report confirming that previous reforms in 1992 and 1999 had done little to increase equality among recipients. Following figure 5 illustrates CAP support inequality with a payment- Lorenz curve. Figure 5: Inequality of direct payments in 2002 100.00% 90.00% Cumulative (ascending) share of expenditure 80.00% 70.00% 60.00% 50.00% 40.00% 30.00% 86.78%; 27.63% 20.00% 10.00% 0.00% 0.00% 20.00% 40.00% 60.00% 80.00% 100.00% Cumulative (ascending) share of number of beneficiaries Note 1: Data displays distribution in the EU15. Nota 2: This figure excludes those ‘recipients’ who, due to uncovered fraud or other reasons, had to pay the EU, instead of receiving a payments from the EU. These ‘recipients’ made up 0.05% of the total recipients and combined, they contributed € 7,5 million or 0.03% of the total direct payments budget that year. Source: Author’s compilation and calculations based on the DG AGRI (2004) data obtained through personal correspondence with Mr. Rudi Genbrugge, Assistant External Auditor at the DG AGRI. A further study by the OECD (2003, 5) showed how the majority of European farmers really made a living: part-time farming had been on the rise for decades this can be attributed largely to the fact that despite its vast cost, the CAP was unable to provide enough income to many 31