Page 37 - Microsoft Word - CEU_MA_Thesis_ARDI_PRIKS_FINAL_v1.3.docx
P. 37
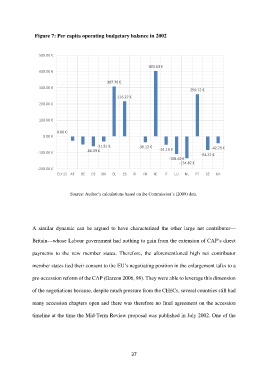
Figure 7: Per capita operating budgetary balance in 2002 500.00 € 403.64 € 400.00 € 307.76 € 300.00 € 259.72 € 216.27 € 200.00 € 100.00 € 0.00 € 0.00 € ‐31.51 € ‐36.12 € ‐42.70 € ‐60.09 € ‐51.18 € ‐100.00 € ‐84.22 € ‐108.40 € ‐134.82 € ‐200.00 € EU‐15 AT BE DE DK EL ES FI FR IE IT LU NL PT SE UK Source: Author’s calculations based on the Commission’s (2009) data. A similar dynamic can be argued to have characterized the other large net contributor— Britain—whose Labour government had nothing to gain from the extension of CAP’s direct payments to the new member states. Therefore, the aforementioned high net contributor member states tied their consent to the EU’s negotiating position in the enlargement talks to a pre-accession reform of the CAP (Garzon 2006, 98). They were able to leverage this dimension of the negotiations because, despite much pressure from the CEECs, several countries still had many accession chapters open and there was therefore no final agreement on the accession timeline at the time the Mid-Term Review proposal was published in July 2002. One of the 37